Debugging the builtin ESP32s3 debugger
- terrycornall
- Jul 18, 2023
- 18 min read

Updated: Oct 8, 2024
The ESP32-s3 is supposed to have a built-in JTAG accessible via the USB. But danged if anyone has explained (at a level I can follow anyway) how you configure and use it with Arduino, or VSCODE. Here are my feeble attempts.
TLDR: Conclusion
My conclusion is that with a number of workarounds and tweaking of how to configure it, it can be made to work from VSCODE but not yet Arduino IDE (Tho I think it's close) In my opinion it is clunky, unreliable and inconvenient but maybe it can be re-habilitated by better processes and configuration.
UPDATE: See IDE 2.3.0 debugging esp32s3 using built-in usb jtag - Software / IDE 2.x - Arduino Forum where updates to the esp32 platform in Arduino ide apparently make it much easier/possible.
View from a distance
A lot of the info on the interweb deals with details, rightly so, but misses the big picture, which is also needed if one is going to read between the lines. This is necessitated by the variety of different setups. (Different platforms, targets, IDEs etc ). Here is what I have nutted out, for a Windows 10 PC:
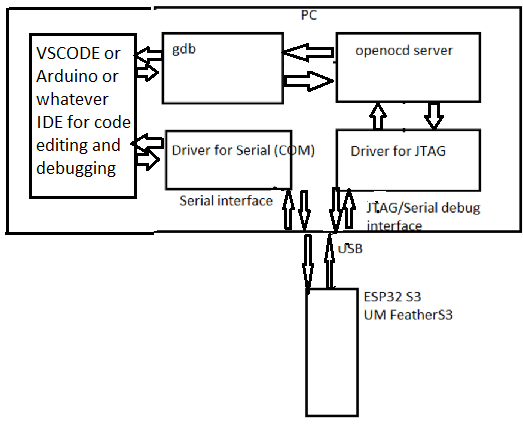
There is but one USB connector to the FeatherS3 (The ESP32S3 target device) from the PC but it is used to provide both the serial port used for 'normal' programming from ArduinoIDE and VSCODE IDE and it also provides the JTAG interface for debugging. (USB can provide multiple channels on the one physical connection).
Openocd is s/w running on the PC that connects via the JTAG interface to the target and provides a server for gdb (Gnu debugger app) running either as standalone commandline app or more usefully invoked from VSCODE IDE (or eventually) Arduino IDE which provides services such as breakpoint selection etc.
As it happens, I have both openocd and gdb installed as part of the esp32 core package that one can get for the Arduino IDE and I am using the Arduino framework from VSCODE. This is an arrangement that works for me. I'd love to do it all from Arduino IDE (and I can, sorta, except that at the moment I don't think I can get the builtin JTAG debugging working in Arduino IDE. Maybe in the future....)
You need the right drivers for the JTAG interface and the default ones that Microsoft applies are not the ones we need, so we apparently need to replace them. (See section below about Zadig tool)
JTAG and Serial USB devices
With the Unexpected Maker Feathers3 plugged in via its one USB cable, I do see it on COM5 and I also see the JTAG/serial debug.

Here are some details (the hardware ids) of the JTAG/Serail debug unit
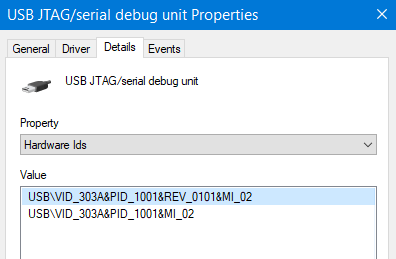
I probably need to know those VID and PIDs.... and that MI_02 looks important too... (turns out to be the interface number. See below in the Zadig section where I mess about with the driver.
Arduino (This has changed since I wrote it and might work now (since 2024))
UPDATE: See IDE 2.3.0 debugging esp32s3 using built-in usb jtag - Software / IDE 2.x - Arduino Forum where updates to the esp32 platform in Arduino ide apparently make it much easier/possible.
Having delved deep, I think it is NOT going to work out of the box with Arduino IDE. The sticking point is that the Arduino IDE v2.1 is convinced that it should be debugging an ARM Cortex cpu and fails because it can't find the arm toolchain. I present as evidence the contents of the launch.json file that Arduino somehow comes up with. (If I could find where to modify it, that'd be nice, but what I found appears to be generated on the fly so modding it would be temporary at best:
{ "version": "0.2.0", "configurations": [ { "cwd": "${workspaceRoot}", "name": "Arduino", "request": "launch", "type": "cortex-debug", "executable": "C:\\Users\\terry\\AppData\\Local\\Temp\\arduino\\sketches\\F451CDC7D3F02AC7C38309DFE30DBC20/esp32_s3_clock.ino.elf", "servertype": "openocd", "serverpath": "C:\\Users\\terry\\AppData\\Local\\Arduino15\\packages\\esp32\\tools\\openocd-esp32\\v0.11.0-esp32-20221026/bin/openocd", "armToolchainPath": "C:\\Users\\terry\\AppData\\Local\\Arduino15\\packages\\esp32\\tools\\xtensa-esp-elf-gdb\\11.2_20220823/bin/", "configFiles": [ "debug.cfg" ] } ] }
It is half right in that it finds the directories for openOCD (which I believe should be used) but then insists that there ought to be an ARM toolchain as well.
Customise launch.json?
I see from discussions in [ INFO ] Debug functionality: an update · Issue #87 · arduino/arduino-ide · GitHub that launch.json can loads settings from platform.txt. So finding and hacking platform.txt for the target board would be a good idea... In my setup it's in: C:\Users\terry\AppData\Local\Arduino15\packages\esp32\hardware\esp32\2.0.10
and as far as I can tell its parameters are correct. There's nothing in there about arm-cortex so where that comes from, I dunno.
In the same directory is the boards.txt and in the esp32C3 (not the S3 whcih is what I am interested in) I see a bunch of things like:
esp32c3.menu.JTAGAdapter.builtin.build.openocdscript=esp32c3-builtin.cfg
I suspect I could steal those and put them in the S3 menu section too...
I see from Information about debugging? - Software / IDE 2.x - Arduino Forum advice to add a file named "debug_custom.json" to your sketch folder and use this content to override the autogenerated stuff as discussed above. This is for a different setup so all the parameters would be different. The serverpath and servertype are already correct in the autogenerated stuff so they shouldn't be overridden, but the 'type": "cortex_debug" above is definitely wrong. (What should it be? Dunno. esp32?)
//debug_custom.json in your workspace (i.e. with your .ino file)
{  //note that these are all wrong for what I want to do...
    "servertype": "jlink",
    "interface": "swd",
    "device": "nRF52840_xxAA",
    "serverpath": "C:/Program Files(x86)/SEGGER/JLink/JLinkGDBServerCL.exe"
}
No doubt there is/will-be a way to reconfigure Aurduino to do the right thing, but I can't find enough info on it. Anyway, I need a clear idea about what works with what, so going the Command Line (CLI) method to begin with is a good idea.
Eventually it needs to be run from an IDE otherwise selecting breakpoints and variables to watch is going to be painfully fiddly. Hopefully someone clever will come up with a way to coerce the Arduino IDE to play nice...
Commandline interface (CLI)
I tried to run it all manually to start with.
It looks like GDB tries to connect with a server on port 3333, so I start openocd first, to connect to the target and provide a server to gdb on 3333.
OPENOCD
In a cmd window I started openocd but got errors about a missing openocd.cfg file so I went looking and found esp32s3-builtin.cfg:
cd C:\Users\terry\AppData\Local\Arduino15\packages\esp32\tools\openocd-esp32\v0.12.0-esp32-20230419\bin

openocd -f board/esp32s3-builtin.cfg
Initially I was getting "Could not find or open device". There are two issues here.
Driver. See below for info on the Zadig driver tool.
Boot-reset. You MAY have to press the boot-reset buttons on the target before running openocd (However I am not sure. I seem to be able to now connect better if I don't do that. See section below called "To Boot-reset or NOT to boot-reset, that is the question" because maybe boot-reset is NOT a good idea after all. Looks to me like pressing just reset so that the code is running on the target before starting openocd is the best way to go, then using GDB to restart the code.))
The output now (after applying the Zadig driver fix below) looks pretty good. Appears to have found JTAG, reset the Feathers3 and is now waiting listening on port 3333 for gdb.
ZADIG driver tool (Be careful not to clobber the COM port)
(NOTE: I am not completely convinced I needed to do this. Should try putting back the original driver (whichever it was) and trying again with all the other issues (like boot-reset the target or not) resolved.)
Anyway, following advice from the interweb, I got zadig from Zadig - USB driver installation made easy (akeo.ie) and ran it (Note To Self: Look in downloads) and played a bit. Got somewhere but not completely sure what I did. I replaced the original driver for USB JTG/serial debug unit (interface 2) with one of the following from the Zadig tool.
worked WinUSB(v6.1.7600.16385) but does show LIBUSB_NOT_FOUND errors. Stalls sometimes but that might have been the silly sequence of gdb commands I was initially using.
worked better? libusb0(v1.2.7.3) also shown as libusb-win32 (v1.2.7.3) also shows libusb_open() failed with LIBUSB_ERROR_NOT_SUPPORTED
worked libusbK Didn't bother going any further with this but I think it works too?
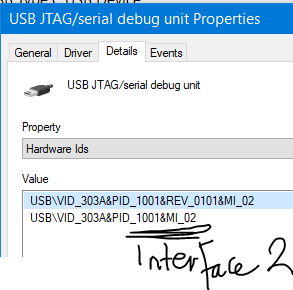
It's difficult to know which of the drivers Zadig gives that I should use (Because they all seemed to work!) but it is important that you do it to the correct interface:
USB JTG/serial debug unit (interface 2)
NOT JTAG/Serial interface 0 which appears to be the COM port. You may need to use Device Manager, properties->details->hardware ids and decipher the vids and pids to see the interface number for the COM and JTAG so you know which one to then look for in Zadigs list of devices. e.g.

When doing this, check that the COM port associated with the serial connection to the Feathers3 doesn't disappear. If it does, undo what you did (and maybe put USB Serial(CDC) driver on it?) and try the other JTAG/Serial debug interface. (See BRICKED IT section below)
If successful, you should see that when you try to run openocd manually as above you see that although it reports errors and warnings, it does at least stay connected and starts a gdb server on port 3333
GDB
Then I started gdb using:
C:\Users\terry>cd C:\Users\terry\AppData\Local\Arduino15\packages\esp32\tools\xtensa-esp-elf-gdb\11.2_20220823\bin

C:\Users\terry\AppData\Local\Arduino15\packages\esp32\tools\xtensa-esp-elf-gdb\11.2_20220823\bin>xtensa-esp32s3-elf-gdb.exe C:\Users\terry\Documents\Arduino\esp32_s3_clock\build\esp32_s3_clock.ino.elf
(gdb) target extended-remote localhost:3333
Now, in the openocd window, I get:
Info : Listening on port 3333 for gdb connections
Info : [esp32s3.cpu0] Debug controller was reset.
Info : [esp32s3.cpu0] Core was reset.
Info : [esp32s3.cpu0] Target halted, PC=0x40041A76, debug_reason=00000000
Info : [esp32s3.cpu0] Reset cause (1) - (Power on reset)
Error: [esp32s3.cpu1] Unexpected OCD_ID = 00000000
Error: [esp32s3.cpu1] Unexpected OCD_ID = 00000000
Error: [esp32s3.cpu1] Unexpected OCD_ID = 00000000
Error: [esp32s3.cpu1] Unexpected OCD_ID = 00000000
Error: [esp32s3.cpu1] Unexpected OCD_ID = 00000000
Info : accepting 'gdb' connection on tcp/3333
Info : [esp32s3.cpu0] Target halted, PC=0x40041A7C, debug_reason=00000000
Info : Set GDB target to 'esp32s3.cpu0'
Warn : No symbols for FreeRTOS!
Info : [esp32s3.cpu0] Target halted, PC=0x403B2482, debug_reason=00000001
Info : Flash mapping 0: 0x10020 -> 0x3c090020, 114 KB
Info : Flash mapping 1: 0x30020 -> 0x42000020, 516 KB
Info : [esp32s3.cpu0] Target halted, PC=0x403B2482, debug_reason=00000001
Info : Auto-detected flash bank 'esp32s3.cpu0.flash' size 16384 KB
Info : Using flash bank 'esp32s3.cpu0.flash' size 16384 KB
Info : [esp32s3.cpu0] Target halted, PC=0x403B2482, debug_reason=00000001
Info : Flash mapping 0: 0x10020 -> 0x3c090020, 114 KB
Info : Flash mapping 1: 0x30020 -> 0x42000020, 516 KB
Info : Using flash bank 'esp32s3.cpu0.irom' size 520 KB
Info : [esp32s3.cpu0] Target halted, PC=0x403B2482, debug_reason=00000001
Info : Flash mapping 0: 0x10020 -> 0x3c090020, 114 KB
Info : Flash mapping 1: 0x30020 -> 0x42000020, 516 KB
Info : Using flash bank 'esp32s3.cpu0.drom' size 116 KB
Info : New GDB Connection: 1, Target esp32s3.cpu0, state: halted
Error: FreeRTOS maximum used priority is unreasonably big, not proceeding: 75
So I am getting close, but have an issue with the freeRTOS code that is on the FeatherS3. I have seen hints on the interweb that a workaround is to always power-cycle the target to avoid the "RTOS to high priority" error.
Running GDB and OPENOCD with VSCODE
I found that now (after changing drivers for the USB JTAG/Serial interface and using esp32s3-builtin.cfg as described above) with enough fiddling with launch.json (see How to get vscode debugging working with openocd? - Question | Mbed) for the gdb debugging in VSCODE I could get it to run gdb and connect on port 3333 with the openocd (started manually in a cmd window as above, after boot-reset of the feathers3 (but see section below called "To Boot-reset or NOT to boot-reset, that is the question" because maybe boot-reset is NOT a good idea after all.)
I see there are issues with the filesystem notation. I had to use literally
C:/Users/terry/Documents/Arduino/esp32_s3_clock/build/esp32_s3_clock.ino.elf in the launch.json section dealing with parameters for GDB. It didn't like "\\" and had similar issues with macros like "${workspaceRoot}/../build/${fileBasename}.elf". (I had seen others using literals instead of macros and now I know why...)
The parameters in the launch.json setupCommands[] are NOT gdb commands directly, it appears, though no doubt they are translated into them by something. I need more info about what should go in there.
...........
BRICKED IT! (Actually not)
Actually I wonder if I have bricked the Feathers3... Don't seem to be able to upload code to it 'normally' now (i.e. thru the serial COM port rather than JTAG). Ooops. Try Arduino IDE. Hmm, can't get a 'com port' for it. Is this because of my fiddling with Zidag? (Yes, probably) I'll see if using Zadig and putting WinUSB driver back onto JTAG/Serial debug interface 0 will get it back... Nope... Uninstall drivers and replug? Nope. Update drivers (without using Zadig) Nope. Press boot-reset button combo, Nope.
Finally, to fix it I had to use Windows Device Manager, find the libusbk JTAG/Serial (interface0) device, request update driver, ask Windows nicely to show me a list of compatible drivers and manually chose the one right at the bottom that said Serial rather than JTAG. (Trying to do this automatically just failed to change anything...)
Com port is back again. Programming the board works again. When the shaking stops I'll try again to get JTAG debug working....
To Boot-reset or NOT to boot-reset? that is the question
I had thought boot-reset before running openocd was needed but I actually see now that better results happen if you have pressed simply reset. However it doesn't seem to work every time. You need to time the delay after reset before you start openocd carefully (actually it is really hit and miss. I got it to work once....)
What does seem to work best is to do boot-reset, then upload program, then reset then run openocd immediately
No sleeping on the job
I just realised that my use of the esp_light_sleep_start() in the code is probably causing issues... I replaced it with delay instead. Now openocd is more consistent about connecting properly. Duh!.
Making progress
The trace below was from opencd run after I programmed the Feathers3 via com16 (i.e. the 'normal' way), (and with the code not using esp_light_sleep._start()..) and then pressed reset to start the code running. Then I ran openocd as shown and I don't see any errors! (Except that "libusb not found" thing and I'm not sure it matters)
C:\Users\terry\AppData\Local\Arduino15\packages\esp32\tools\openocd-esp32\v0.11.0-esp32-20221026\bin>openocd -f board/esp32s3-builtin.cfg
Open On-Chip Debugger v0.11.0-esp32-20221026 (2022-10-26-14:48)
Licensed under GNU GPL v2
For bug reports, read
        http://openocd.org/doc/doxygen/bugs.html
Info : only one transport option; autoselect 'jtag'
Info : esp_usb_jtag: VID set to 0x303a and PID to 0x1001
Info : esp_usb_jtag: capabilities descriptor set to 0x2000
Warn : Transport "jtag" was already selected
Info : Listening on port 6666 for tcl connections
Info : Listening on port 4444 for telnet connections
Error: libusb_open() failed with LIBUSB_ERROR_NOT_SUPPORTED
Info : esp_usb_jtag: serial (70:04:1D:AD:8D:A0)
Info : esp_usb_jtag: Device found. Base speed 40000KHz, div range 1 to 255
Info : clock speed 40000 kHz
Info : JTAG tap: esp32s3.cpu0 tap/device found: 0x120034e5 (mfg: 0x272 (Tensilica), part: 0x2003, ver: 0x1)
Info : JTAG tap: esp32s3.cpu1 tap/device found: 0x120034e5 (mfg: 0x272 (Tensilica), part: 0x2003, ver: 0x1)
Info : starting gdb server for esp32s3.cpu0 on 3333
Info : Listening on port 3333 for gdb connections
Info : [esp32s3.cpu0] Debug controller was reset.
Info : [esp32s3.cpu0] Core was reset.
Info : [esp32s3.cpu1] Debug controller was reset.
Info : [esp32s3.cpu1] Core was reset.
Info : [esp32s3.cpu0] Target halted, PC=0x4207D392, debug_reason=00000000
Info : [esp32s3.cpu0] Reset cause (1) - (Power on reset)
Info : [esp32s3.cpu1] Target halted, PC=0x4207D392, debug_reason=00000000
Info : [esp32s3.cpu1] Reset cause (1) - (Power on reset)
Info : accepting 'gdb' connection on tcp/3333
Info : [esp32s3.cpu0] Target halted, PC=0x403798C1, debug_reason=00000000
Info : Set GDB target to 'esp32s3.cpu0'
Info : [esp32s3.cpu1] Target halted, PC=0x4207D392, debug_reason=00000000
Warn : No symbols for FreeRTOS!
Info : [esp32s3.cpu0] Target halted, PC=0x403B2482, debug_reason=00000001
Info : Flash mapping 0: 0x10020 -> 0x3c090020, 114 KB
Info : Flash mapping 1: 0x30020 -> 0x42000020, 517 KB
Info : [esp32s3.cpu0] Target halted, PC=0x403B2482, debug_reason=00000001
Info : Auto-detected flash bank 'esp32s3.cpu0.flash' size 16384 KB
Info : Using flash bank 'esp32s3.cpu0.flash' size 16384 KB
Info : [esp32s3.cpu0] Target halted, PC=0x403B2482, debug_reason=00000001
Info : Flash mapping 0: 0x10020 -> 0x3c090020, 114 KB
Info : Flash mapping 1: 0x30020 -> 0x42000020, 517 KB
Info : Using flash bank 'esp32s3.cpu0.irom' size 520 KB
Info : [esp32s3.cpu0] Target halted, PC=0x403B2482, debug_reason=00000001
Info : Flash mapping 0: 0x10020 -> 0x3c090020, 114 KB
Info : Flash mapping 1: 0x30020 -> 0x42000020, 517 KB
Info : Using flash bank 'esp32s3.cpu0.drom' size 116 KB
Info : New GDB Connection: 1, Target esp32s3.cpu0, state: halted
Info : JTAG tap: esp32s3.cpu0 tap/device found: 0x120034e5 (mfg: 0x272 (Tensilica), part: 0x2003, ver: 0x1)
Info : JTAG tap: esp32s3.cpu1 tap/device found: 0x120034e5 (mfg: 0x272 (Tensilica), part: 0x2003, ver: 0x1)
Info : [esp32s3.cpu0] requesting target halt and executing a soft reset
Info : [esp32s3.cpu0] Debug controller was reset.
Info : [esp32s3.cpu0] Core was reset.
Info : [esp32s3.cpu0] Target halted, PC=0x500000EF, debug_reason=00000000
Info : [esp32s3.cpu0] Reset cause (3) - (Software core reset)
Info : [esp32s3.cpu1] requesting target halt and executing a soft reset
Info : [esp32s3.cpu0] Core was reset.
Info : [esp32s3.cpu0] Target halted, PC=0x40000400, debug_reason=00000000
Info : [esp32s3.cpu1] Debug controller was reset.
Info : [esp32s3.cpu1] Core was reset.
Info : [esp32s3.cpu1] Target halted, PC=0x40000400, debug_reason=00000000
Info : [esp32s3.cpu1] Reset cause (3) - (Software core reset)
Info : [esp32s3.cpu0] Reset cause (3) - (Software core reset)
Info : [esp32s3.cpu1] Debug controller was reset.
Info : [esp32s3.cpu1] Core was reset.
Info : [esp32s3.cpu1] Target halted, PC=0x4207D392, debug_reason=00000000
Info : [esp32s3.cpu1] Reset cause (3) - (Software core reset)
Didn't whinge about cpu1 or ocd-id 000000 or freertos or anything. The program running on cpu1 (and apparently the rtos wifi code on cpu0 too) halted.
An interesting thing to do now would be to run gdb, connect to port 3333 and issue a 'r' command to restart it:
C:\Users\terry>cd C:\Users\terry\AppData\Local\Arduino15\packages\esp32\tools\xtensa-esp-elf-gdb\11.2_20220823\bin

C:\Users\terry\AppData\Local\Arduino15\packages\esp32\tools\xtensa-esp-elf-gdb\11.2_20220823\bin>xtensa-esp32s3-elf-gdb.exe C:\Users\terry\Documents\Arduino\esp32_s3_clock\build\esp32_s3_clock.ino.elf
GNU gdb (esp-gdb) 11.2_20220823
Reading symbols from C:\Users\terry\Documents\Arduino\esp32_s3_clock\build\esp32_s3_clock.ino.elf...
(gdb) target extended-remote localhost:3333
Remote debugging using localhost:3333
0x403798c1 in _xt_lowint1 ()
    at /Users/ficeto/Desktop/ESP32/ESP32S2/esp-idf-public/components/freertos/port/xtensa/xtensa_vectors.S:1114
1114    /Users/ficeto/Desktop/ESP32/ESP32S2/esp-idf-public/components/freertos/port/xtensa/xtensa_vectors.S: No such file or directory.
So it looks like this has had some success, even though it complains about a missing file.
Also I seem to be able to issue a 'run' command in gdb and restart it all.
(gdb) r
The program being debugged has been started already.
Start it from the beginning? (y or n) y
Starting program: C:\Users\terry\Documents\Arduino\esp32_s3_clock\build\esp32_s3_clock.ino.elf
[esp32s3.cpu1] Debug controller was reset.
[esp32s3.cpu1] Core was reset.
[esp32s3.cpu1] Target halted, PC=0x4207D392, debug_reason=00000000
[esp32s3.cpu1] Reset cause (3) - (Software core reset)
And the code on cpu1 restarts and then keeps running. (Hopefully the code on cpu0 as well)
Sometimes gdb doesn't appear to come back to allow other commands, but sometimes it does.
Sometimes openocd seems to lose connection and needs to be restarted. (See next section for resolution of both these issues. Is possible (likely) that gdb interface won't come back if ther is no breakpoint.... I think I need a breakpoint...)
openocd/GDB command sequence that doesn't hang
After connecting the Feathers3 (previously programmed with something simple, plus with the RTOS layer that you get anyway if using Arduino framework, (even if you are using VSCODE as the IDE but still using Arduino framework as I am) and pressing reset on the FeatherS3 to run it then running opencd in a cmd window:
cd C:\Users\terry\AppData\Local\Arduino15\packages\esp32\tools\openocd-esp32\v0.11.0-esp32-20221026\bin
openocd -f board/esp32s3-builtin.cfg
and then in a new cmd window starting gdb:
cd C:\Users\terry\AppData\Local\Arduino15\packages\esp32\tools\xtensa-esp-elf-gdb\11.2_20220823\bin
xtensa-esp32s3-elf-gdb.exe C:\Users\terry\Documents\Arduino\esp32_s3_clock\build\esp32_s3_clock.ino.elf
Here is a sequence of gdb commands that restarts the code and breaks at line 1. It seems to work and doesn't just hang. Just how useful this sequence is, I dunno but it does seem to be working (using the libusb0/WINUSB driver from Zadig for the JTAG/Serial debug device). The reason for showing this sequence is that just doing random things in GDB (such as restarting but with no breakpoint set) will result in GDB becoming non-responsive. Ideally I need to work out how to do this from the VSCODE IDE (since Arduino IDE is being bitchy about no arm debug toolchain...)
target extended-remote localhost:3333
b 1                //set a breakpoint at line 1
r                  //restart (and it should break at line 1)
n                  //step one line

ret    //I think hitting return with no arg repeat last command?
launch.json for debug setup in VSCODE
To be able to run gdb from vscode, I need to setup a debug configuration for it for the source file type (.ino because I am using Arduino platfrom from vscode)
The configuration is done via a launch.json file.
Run vscode and setup the project for your .ino file. Open the .ino file in the editor
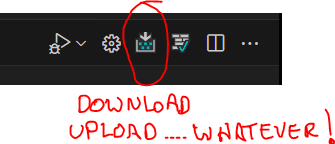
On the righthand side at the top is a bunch of little icons. Hover over the 'settings' wheel and it shows "add configuration"
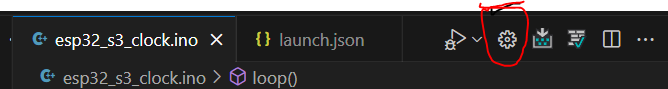
Press it and then you get asked something and you select something (trouble is I forget what I did and I don't want to undo it and start again...) and magically you get a launch.json file to fill in. Eventually my launch.json looks like this (I am not sure of a lot of it, but the 'program' and 'miDebugger' paths to the gdb and to the code are important, and the setting of the remote-extended. Marked in red.):
{
    "version": "0.2.0",
    "configurations": [
        {
            "name": "(gdb opencd) Launch",
            "type": "cppdbg",
            "request": "launch",
            "program": "${workspaceRoot}/../build/${fileBasename}.elf",
            "args": [],
            "stopAtEntry": false,
            "cwd": "${fileDirname}",
            "environment": [],
            "externalConsole": false,
            "MIMode": "gdb",
            "miDebuggerPath": "C:\\Users\\terry\\AppData\\Local\\Arduino15\\packages\\esp32\\tools\\xtensa-esp-elf-gdb\\11.2_20220823\\bin\\xtensa-esp32s3-elf-gdb.exe",
            "setupCommands": [
                {
                    "description": "Enable pretty-printing for gdb",
                    "text": "-enable-pretty-printing",
                    "ignoreFailures": true
                },
                {
                    "description": "Set Disassembly Flavor to Intel",
                    "text": "-gdb-set disassembly-flavor intel",
                    "ignoreFailures": true
                },
                {
                    "text": "-environment-cd ${workspaceRoot}\\..\\build"
                },
                {
                    "text": "-target-select extended-remote localhost:3333",
                    "description": "connect to target",
                    "ignoreFailures": false
                },
                {
                    "text": "-file-exec-and-symbols C:/Users/terry/Documents/Arduino/esp32_s3_clock/build/esp32_s3_clock.ino.elf",
                    "description": "load file",
                    "ignoreFailures": false
                },
                {
                    "text": "-interpreter-exec console \"monitor reset\"",
                    "ignoreFailures": false
                },
                {
                    "text": "-interpreter-exec console \"monitor halt\"",
                    "ignoreFailures": false
                },
                {
                    "text": "-environment-cd ${workspaceRoot}"
                }
            ]
        }
    ]
}
I would program the featherS3 normally first so it has the new code on it. (i.e. hit the download icon.
To use the debugger from vscode YOU HAVE TO START OPEONCD AS DISCUSSED ABOVE EXTERNALLY FIRST.

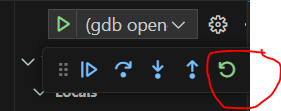
Then MAKING SURE YOU HAVE THE .INO FILE OPEN AND IN FOCUS, hit the little green triangle that appears in the LEFTHAND panel if you select the debug option and select the configuration you created (the name is set in the json file) (fingers crossed) Note that if you still have the launch.json file in focus instead of the .ino file will get funny error comments like "c:\users\blah\blah\bla\launch.json doesn't exist' because of the way the macro identifies the filename of the code to be debugged. This is annoying but easily fixed by changing the focus in the editor to the .ino file you want to debug.
You should see in the cmd window running openocd that stuff happens indicating a connection to gdb and various comments about status.
Info : Listening on port 3333 for gdb connections
Info : [esp32s3.cpu0] Debug controller was reset.
Info : [esp32s3.cpu0] Core was reset.
Info : [esp32s3.cpu1] Debug controller was reset.
Info : [esp32s3.cpu1] Core was reset.
Info : [esp32s3.cpu0] Target halted, PC=0x40056EBC, debug_reason=00000000
Info : [esp32s3.cpu0] Reset cause (21) - (USB UART reset)
Info : [esp32s3.cpu1] Target halted, PC=0x4207D392, debug_reason=00000000
Info : [esp32s3.cpu1] Reset cause (21) - (USB UART reset)
Info : accepting 'gdb' connection on tcp/3333
Info : [esp32s3.cpu0] Target halted, PC=0x420127B4, debug_reason=00000000
Info : Set GDB target to 'esp32s3.cpu0'
Info : [esp32s3.cpu1] Target halted, PC=0x4207D392, debug_reason=00000000
Warn : No symbols for FreeRTOS!
Info : [esp32s3.cpu0] Target halted, PC=0x403B2482, debug_reason=00000001
Info : Flash mapping 0: 0x10020 -> 0x3c090020, 114 KB
Info : Flash mapping 1: 0x30020 -> 0x42000020, 517 KB
Info : [esp32s3.cpu0] Target halted, PC=0x403B2482, debug_reason=00000001
Info : Auto-detected flash bank 'esp32s3.cpu0.flash' size 16384 KB
Info : Using flash bank 'esp32s3.cpu0.flash' size 16384 KB
Info : [esp32s3.cpu0] Target halted, PC=0x403B2482, debug_reason=00000001
Info : Flash mapping 0: 0x10020 -> 0x3c090020, 114 KB
Info : Flash mapping 1: 0x30020 -> 0x42000020, 517 KB
Info : Using flash bank 'esp32s3.cpu0.irom' size 520 KB
Info : [esp32s3.cpu0] Target halted, PC=0x403B2482, debug_reason=00000001
Info : Flash mapping 0: 0x10020 -> 0x3c090020, 114 KB
Info : Flash mapping 1: 0x30020 -> 0x42000020, 517 KB
Info : Using flash bank 'esp32s3.cpu0.drom' size 116 KB
Info : New GDB Connection: 1, Target esp32s3.cpu0, state: halted
Info : JTAG tap: esp32s3.cpu0 tap/device found: 0x120034e5 (mfg: 0x272 (Tensilica), part: 0x2003, ver: 0x1)
Info : JTAG tap: esp32s3.cpu1 tap/device found: 0x120034e5 (mfg: 0x272 (Tensilica), part: 0x2003, ver: 0x1)
Info : [esp32s3.cpu0] requesting target halt and executing a soft reset
Info : [esp32s3.cpu0] Target halted, PC=0x40381ABC, debug_reason=00000000
Info : [esp32s3.cpu0] Reset cause (21) - (USB UART reset)
Info : [esp32s3.cpu1] Reset cause (21) - (USB UART reset)
Info : [esp32s3.cpu1] requesting target halt and executing a soft reset
Info : [esp32s3.cpu0] Core was reset.
Info : [esp32s3.cpu0] Target halted, PC=0x4000051F, debug_reason=00000000
Info : [esp32s3.cpu1] Core was reset.
Info : [esp32s3.cpu1] Target halted, PC=0x40000400, debug_reason=00000000
Info : [esp32s3.cpu1] Reset cause (21) - (USB UART reset)
Info : [esp32s3.cpu0] Halt cause (0) - (Illegal instruction)
Info : [esp32s3.cpu0] Reset cause (21) - (USB UART reset)
Note also that hitting the debug button on the top right doesn't do what you want. (Wrong configuration I think)

Maybe you can set a breakpoint now (by clicking in the source code window for the .ino file to the left of the line number to invoke a red dot

And restart execution from vscode (using the little green circular arrow thingy and its friends?)
After working out that the power-saving slppe options that the ESP32s3 has were going to interfere and replacing them with delays instead, I made progress.
I was able to have it stop at a breakpoint and then continue, to stop at that breakpoint again (in the loop() function that runs again and again)
I added watch variables and they seemed to work.
The time kept by the RTC in there somewhere seems to tick over properly even when we are paused at a breakpoint.
Not sure about delay(). If I hit a breakpoint, wait a bit, then continue, a following delay() seems to be shorter than expected.... hmmm. Or maybe delay() is just generally messed up by debugging in this way. That could be an issue!
I did manage to single 'step over' a few lines abut then it errored with an exception code 0x80004004 inside a task so I don't think we have got it setup quite right yet. Or else using RTOS is just not gonna work. Or maybe it's that RTOS priority thingo I saw errored in openocd "Error: FreeRTOS maximum used priority is unreasonably big, not proceeding: 251" or maybe.... I dunno.
Hmm, hitting restart green circular arrow thingy did seem to reconnect gdb to openocd but I get the same exception again.... and the debugging session stops and I have to launch it again (green triangle)
Bother, sometimes after restarting I get an error on openocd window about:
"Error: FreeRTOS maximum used priority is unreasonably big, not proceeding: 116
Error: FreeRTOS maximum used priority is unreasonably big, not proceeding: 116
Info : dropped 'gdb' connection
Don't forget if you change the code you need to recompile and do the boot-reset on the featherS3 and download it, and then reset it and then restart the debug and maybe restart openocd...pant, pant. Not inconvenient at all.
openocd does seem to stay up and reconnect gdb if you stop and relaunch the debugging session... at least sometimes. Keep an eye on it and restart it if needed. Does seem to need to be relaunched after a download of new code and the boot-reset/download/reset fiddling. It doesnt crash but it keeps refusing gdb connection after that. Close it and restart it and then relaunch the debug session from vscode. Doesn't always work. Must not be holding tongue right way... Read on.
(BTW this boot-reset/download/reset thingy is a bug in the Espressif arduino core or the firmware on the featherS3 or the silicon in the S3 or something. Not vscodes fault....
Also, I wonder about the need for reset before running openocd. I think the failure of running openocd when still in boot-reset after download is due to freeRTOS somehow.
OK, I got things to reconnect by unplugging and replugging the USB to the featherS3 (after downloading code) and then restarting openocd. Sheesh. Still got the 'unreasonably big' error but it seemed to get over it this time and the code stopped at a breakpoint. Whoooh, buggy!
Also, plugging and unplugging causes a power cycle on the target and I've read somewhere that this helps get around the RTOS priority error.


